Generating Plan Views
Plan view is a key product in the design workflow. It presents detailed alignment and embankement information, along with locations for various structures and station markers along the route. Plan views are also used to provide a view of parallely running canal routes, to refine any constructabilty issues.
Generating Full Length Plans
To succesfuly generate plan views for a given route, the profile data must be fully updated. To do this, while the route is selected in plan view:
-
Clear any selection in Profile View area
-
go to
Explore Solutions > Table Data > LSec Profile Data. This will update the profile data for the route.
Then, you can start plan view generation. There are two steps to generate plan view:
-
Create the plan view data from
Explore Solutions > Plan View (Current Route).
This will automatically start creating the data. However, if there is an existing data, you will be promoted with the Re-extract Trail? dialog.
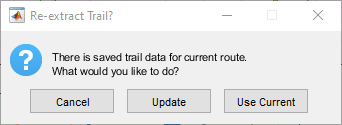
Choose Update if there are any changes to CBL information, otherwise choose Use Current.
-
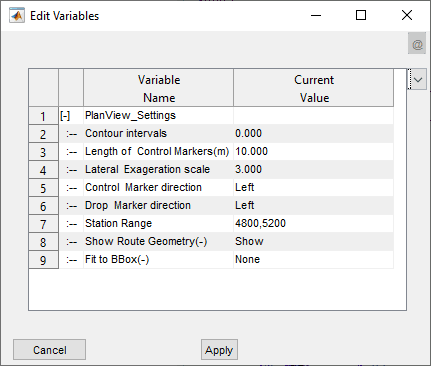
Next the Edit Variables dialog is open, allowing to set specifications for creating the plan drawing.
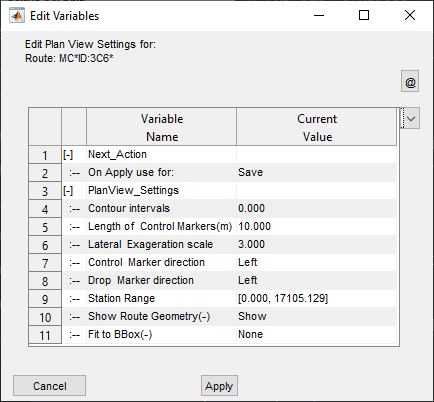
OnApply: Save option simply saves the settings. Generate Drawing option creates the drawing per the table of specification. Use the Save option.
Contour Intervals: the inverval value to be used to generate contour lines with the plan view. a value of <0.5 indicates, no contour is needed. Default is set to 0.
Length of Control Markers: The length of control markers on the plan view. This will also determine the length of station/curve markers.
Note: Providing 0 value supresses all markers. Providing too large a value could result in curve markers crossing each other, giving poor presentation quality. Recommended values are:
-
Large canals 20-40units
-
small canals 5-10 units
Lateral Exageration Scale: Often canal layouts appear as narrow and to conjusted, making it difficult to view details and poor presentation. To aid this, an exageration scale can be set between 1 to 10. Usually, 3 to 5 gives good drawings.
Note: When exageration scale is applied, the distance normal to the route center line is multiplied by the specified scale factor. True ground distance is obtained by dividing the measuered distance in AutoCAD environment to the product of this scale value and that of the plot scale.
Note: too large exageration values may distort true appearance of the layout components on edge, and RoW markers, as well as on contour lines - especially on curve locations.
Note: On posed plan view generation (generating plans of adjacent routes) the exageration scale is set to 1.0.
Control Markers and Drop Markers Direction: The direction of marker lines with respect to the centerline of the alignment route.
Station Range: The range of values to generate plan view for. These are automatically rounded to the nearest available value on the station date list.
Show Route Geometry: control the visibility of route center line, and all curve and control markers.
Fit BBox: Set to None, the plan view is generated in natural North UP orientation. When set to Pick AutoCAD, the user is prompted to pick a bounding object in AutoCAD. The drawing creation attempts to automatically determine the best orientation and scaling for the drawing to fit in to the selected area.
Tip: Upon creating the drawing to AutoCAD the exageration scale is exported along with the north symbol. Use the Aligned Annotation addon tool to generate this info.
Upon hitting Apply, the settings are saved, and the command exits.
-
To create a plan view from the updated data just created above, make sure selection in profile view is cleared, and go to
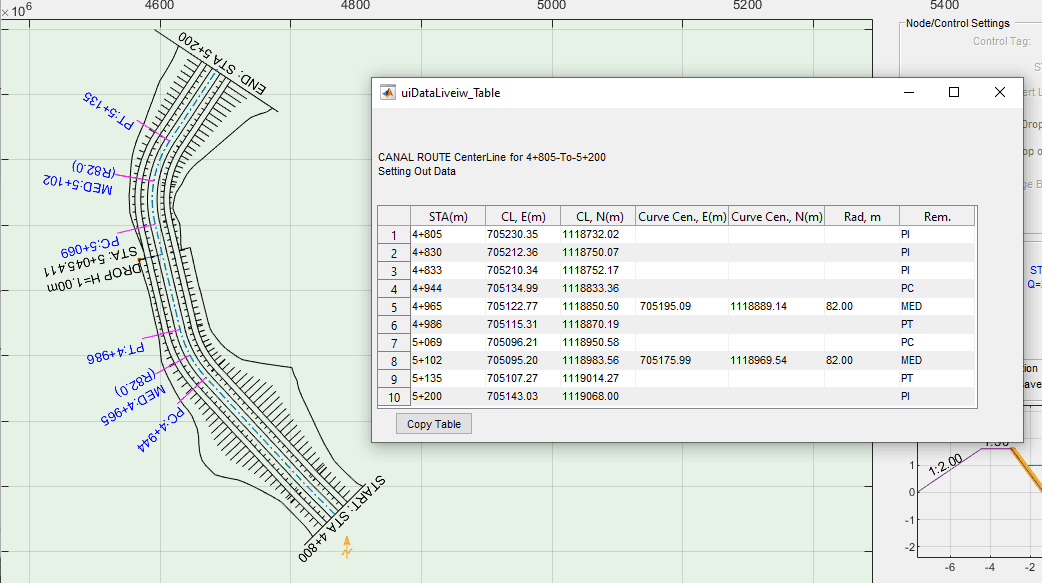
Explore Solutions > Plan View (Contd).This will invoke the variable editor again, allowiing to revise any settings.
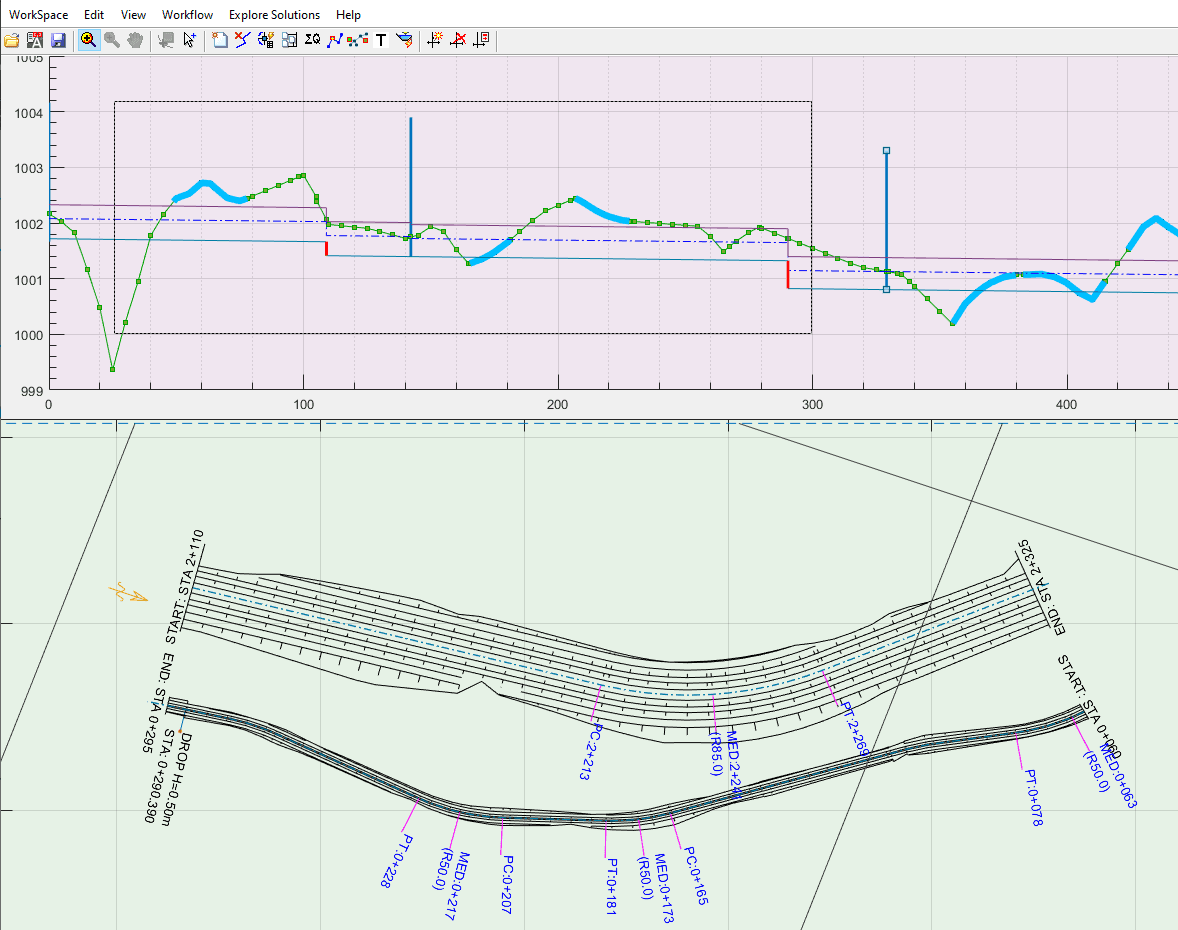
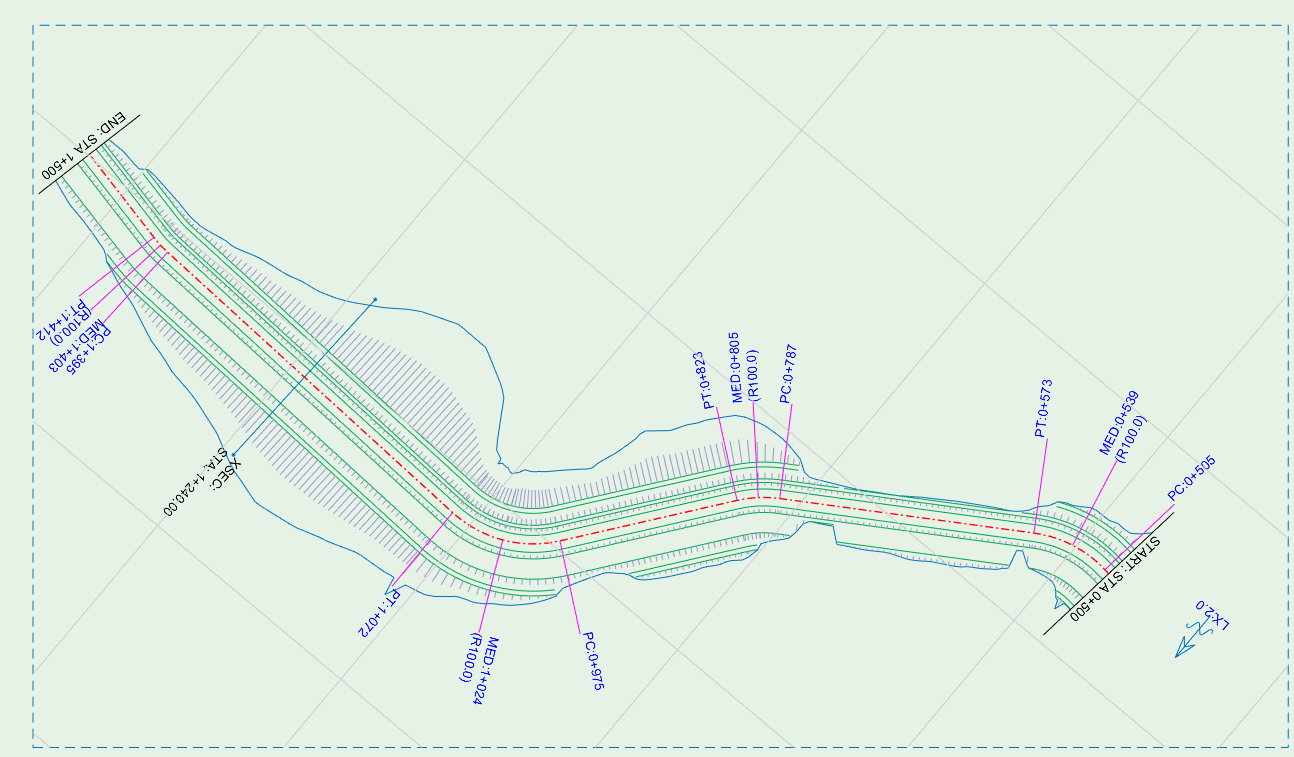
Note the Station Range values are set to the default values of start to end of the route. You can input a valid range, and hit apply. The plan view is generated as shown below. A table data describing the setting out detail for the route of the specified station range is also included.
Note: To create full length plans, leave station range to default values, or seleect full range from the drop down menu.
- To exit from plan view, right click on Plan View Area and choose
Refresh Nodes and Routesoption. This will clear the plan drawing, and repoulate route and node information.
Generating plan views for a selected segement
One can quickly create a plan view for a segment of the route profile as follows:
-
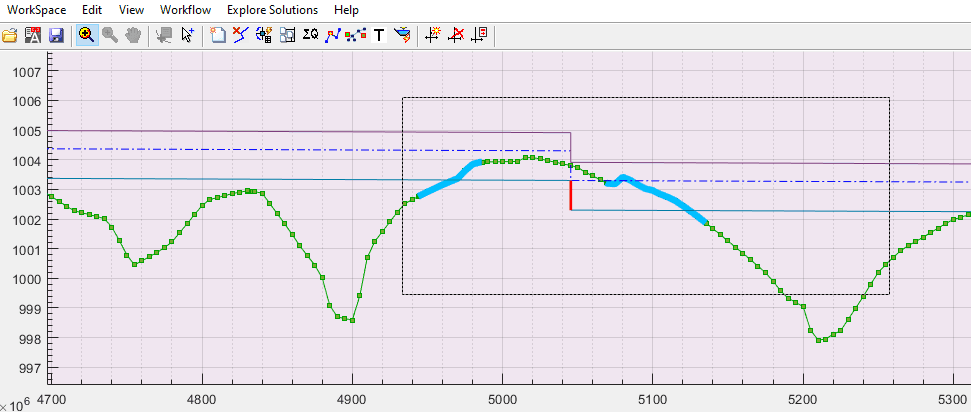
Select a segment in the profile view area.
-
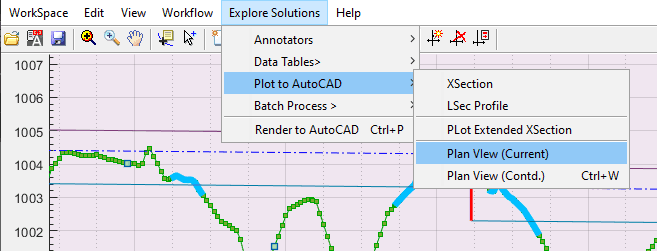
start the command
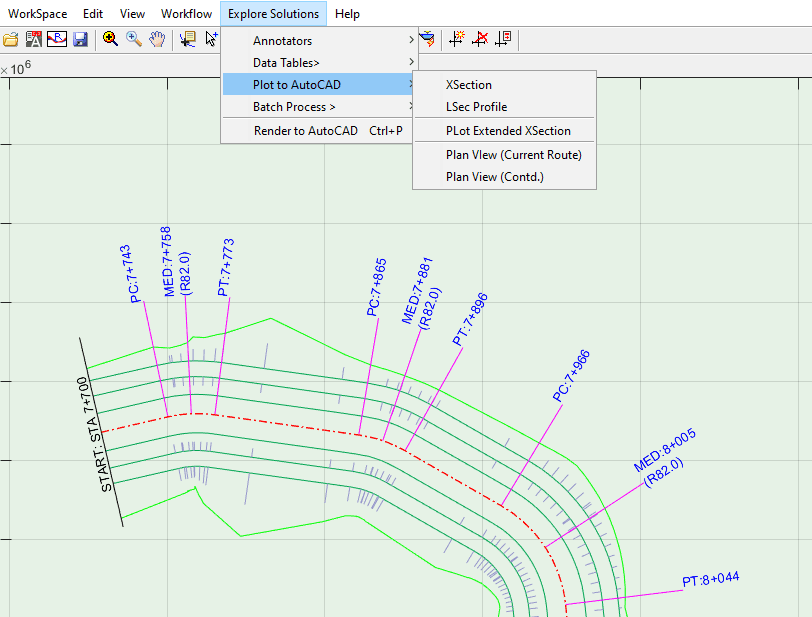
Explore Solutions > Plot to AutoCAD > Plan View (Contd)or use Ctrl+W short cut. The plan fof the selcted segment is generated.
This step is particularly helpful when making modifications to the CBL of a segment, and an updated plan view is needed to see the change. Simply start the profile data update command (Ctrl+L) and request the plan view (Ctrl+W). This saves significant time, especially when working on very long canals where the drawing creation time is relatively longer.
Generating plan view for user defined station range
One can also create plan views from an interactively selected window. To use this method:
-
Select any node in profile view area.
-
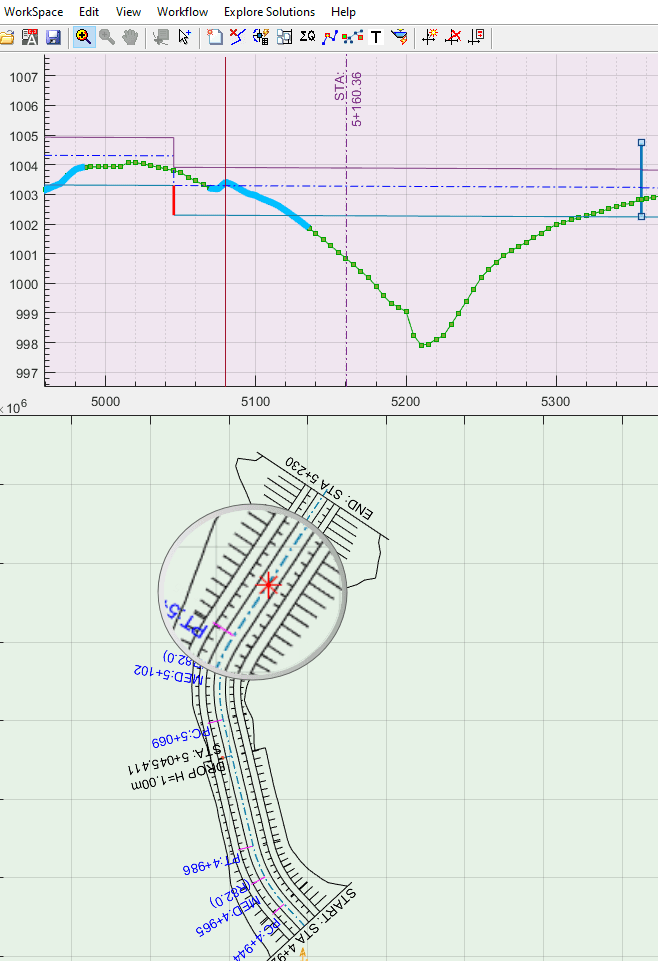
Start the command Ctrl+W. An cursor waits for user input. Click and drag to create the rectangle that represents the desired range of plan view generation. Release when done.
- If the range selected specifies a length less than 100meters, the command exits after blinking the rectangle. Otherwise, the plan view is created for the desired range.
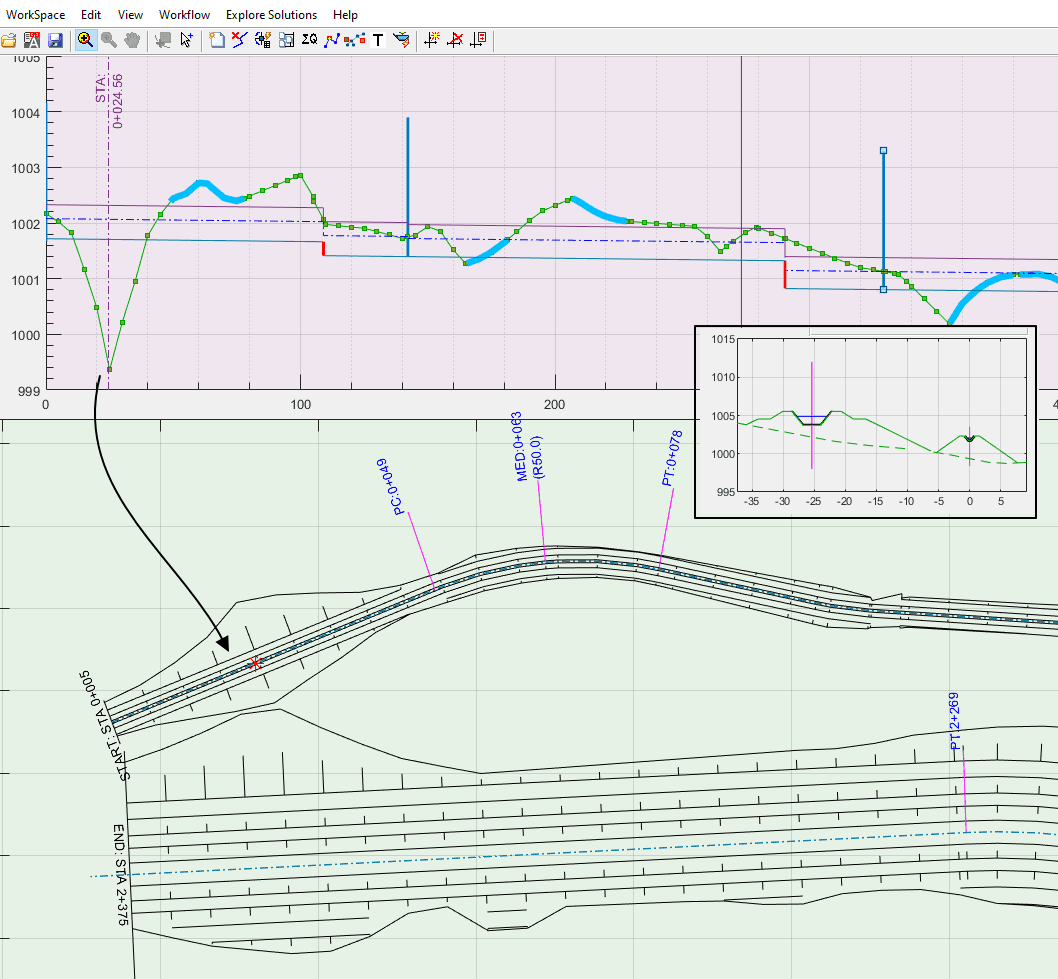
Exploring Sections and Plans to AutoCAD
You can explore sections in plan view in one of two ways. Start the Cross-Sections command from XSEC button, and click on a vertical section bar (solid, not dotted) created in profile view. An interactive vertical bar is created that allows you to pick a section. As you hover in the profile view, a red start marker is shown in plan view, pointing to the exact location of the selected station. Upon click, the section for that station is generated.
Note: This tool also works with any of the annotation markers and drop positioning tools.
You can also create a data tip in plan view along the centerline of the route, and use Ctrl+G key short cut. This will start a dialog confirming the station. Hit Ok to create the section.
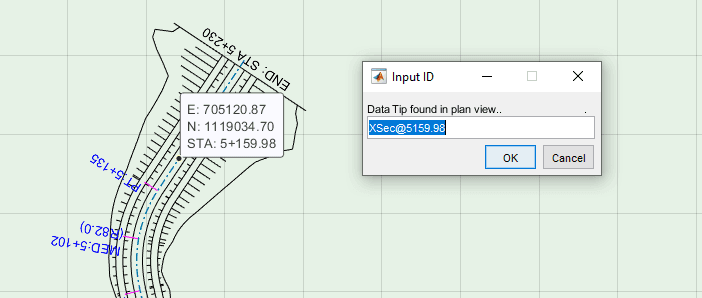
Note: Station information on Data Tips of plan view are re-calculated based on rendered geometery, and may not always be precise to actual stations used to create the cross-section view.
Creating Extended Plan Views
You can generate plan views of two parallelly running canals at the same time, to see any overlap issues or to confirm if adeuate space is maintained between the two. To do this:
-
First, click on the larger canal route which whose plan is needed, and pose it using
Explore Solutions > Plot Extended XSectionmenu command. This will invoke the dialog shown. Accept to confirm.
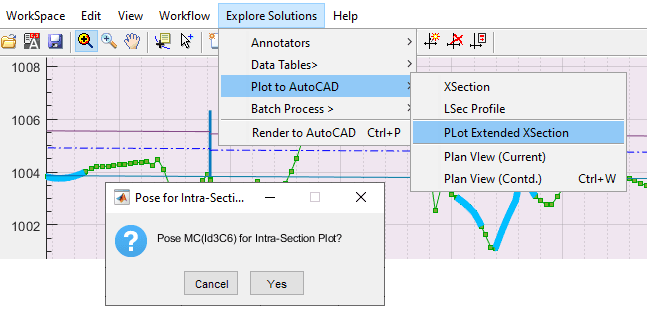
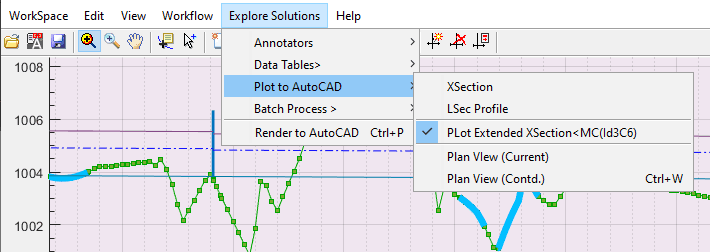
If you go back to the menu, you will notice that the menu is Checked with the name and ID of posed route.
-
Then go to plan view, and click on the other canal route running close to posed canal above and parallel to it. Use one of the above methods to specifiy a plot range for the plan view. The plan view is created for the specified range for both routes.
Note: The range for the posed canal is estimated automatically. No need for the user to input this value.
You can use explore methods mentioned above to visualize and interact in all three view areas.
Note the following points when using this method:
-
Both routes should be uptodate for profile data and plan view data for a succesful plan view creation.
-
Exageration scales are set to 1.00.
-
Contrours may or may not be created depending on the plan view creation settings of both routes.
-
Contours, if created, can not be plotted, because there are two instances of the same data type on plan view.
Automatic Exporting of plan view
The quickest way to generate plan views to AutoCAD is shown below.
-
Start command from
Explore Outputs > Plan Views > Plan View (Contd). In the dialog, set all paramenters as desired, and makesure to choose Pick AutoCAD for Fit to BBox parameter. Hit Apply. -
Work will start but not complete. Go to AutoCAD, and Pick the BBox for plan view. You can choose the same object, or a differnet one. The plan view is now generated rotated and scaled per the original BBox.
- Plot this directly from
workflow > Plot to AutoCAD > Plot Plan to AutoCAD. In AutoCAD select the BBox again. The complete drawing is generated.
Notes on Colors:
-
color standards for producing drawings can be specified in
Workspace > Preferences. -
All drawing elements are generated per set color standard.
-
Axis and their labels, alignment markers and annotations, plan view slope lines and other text information are generated using the currently selected layer, and color in AutoCAD.
-
Annotations and objects are exported to AutoCAD in groups, and its easy to edit them for color or other details.
Manual Exporting plan view or their components to AutoCAD
-
To generate the drawings to AutoCAD, use the standard tool from
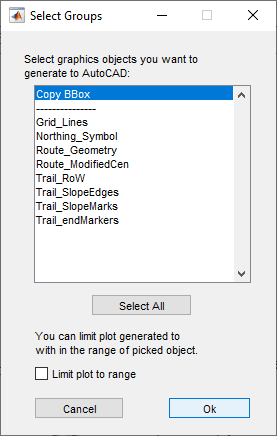
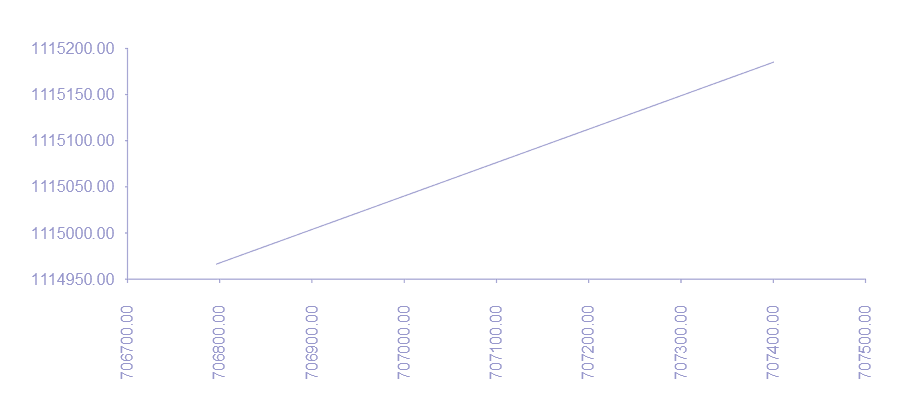
Workflow > Render To AutoCADorCtrl + P, The first step would be to copy the axes information to the region of plot in AutoCAD, hence choose Copy BBox.
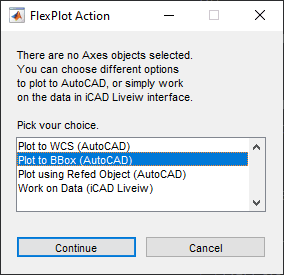
Then selct Plot to BBox (AutoCAD) option, and upon prompt in AutoCAD, pick the object that defines the drawing area.
On On the uiPlotOptions dialog box, choose:
a) ALL: if the plan view is generated using a fit area (as shown in the second figure above)
b) specify a plot scale, otherwise.
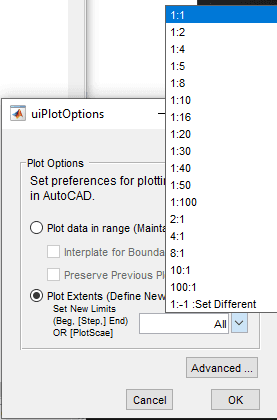
Choose Plot scaling depending on the type of plan view drawing desired Axis reference information created to AutoCAD environment
Once the axis information is created in AutoCAD, along with a referenced starting object, use Workflow > Render to AutoCAD, select all objects, and click Apply. Upon prompt, choose the referenced object, and follow the dialogs to complete generating all groups of objects to AutoCAD.
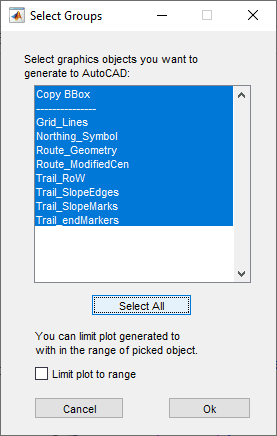
Use Select All button to choose all groups of objects.
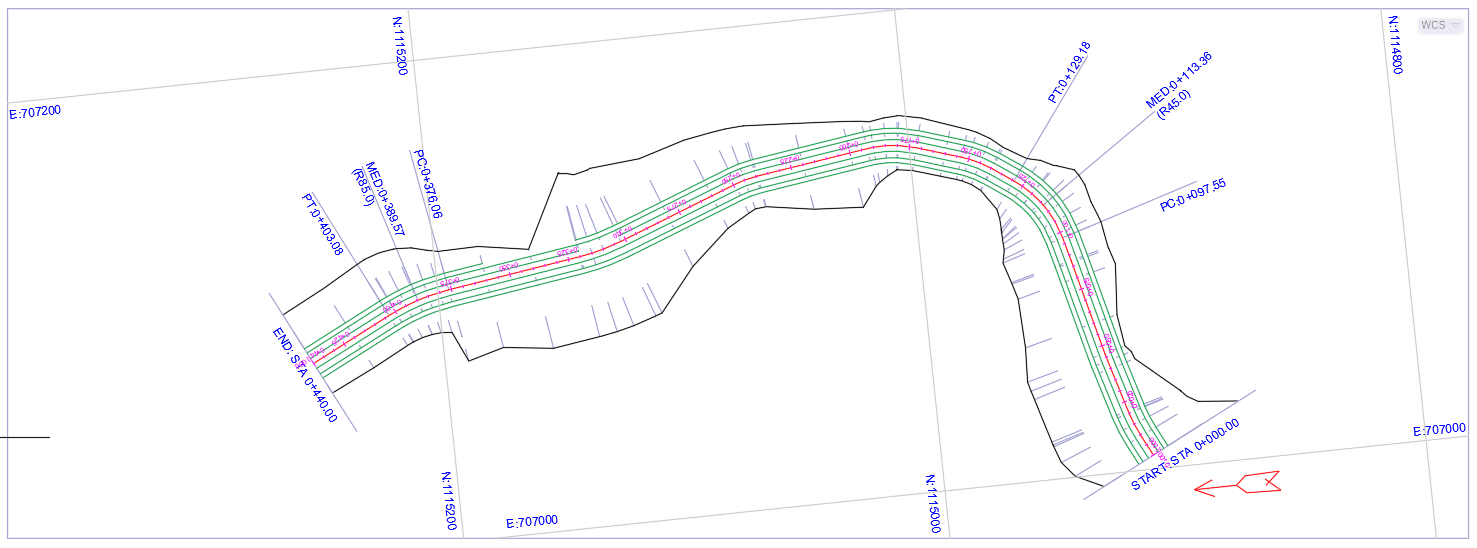
Fig AutoCAD drawing, after few edits on line colors, and text annotation creation.
If only certain components of the drawing are needed, select those only, and continue. The desired elements are added to the drawing.